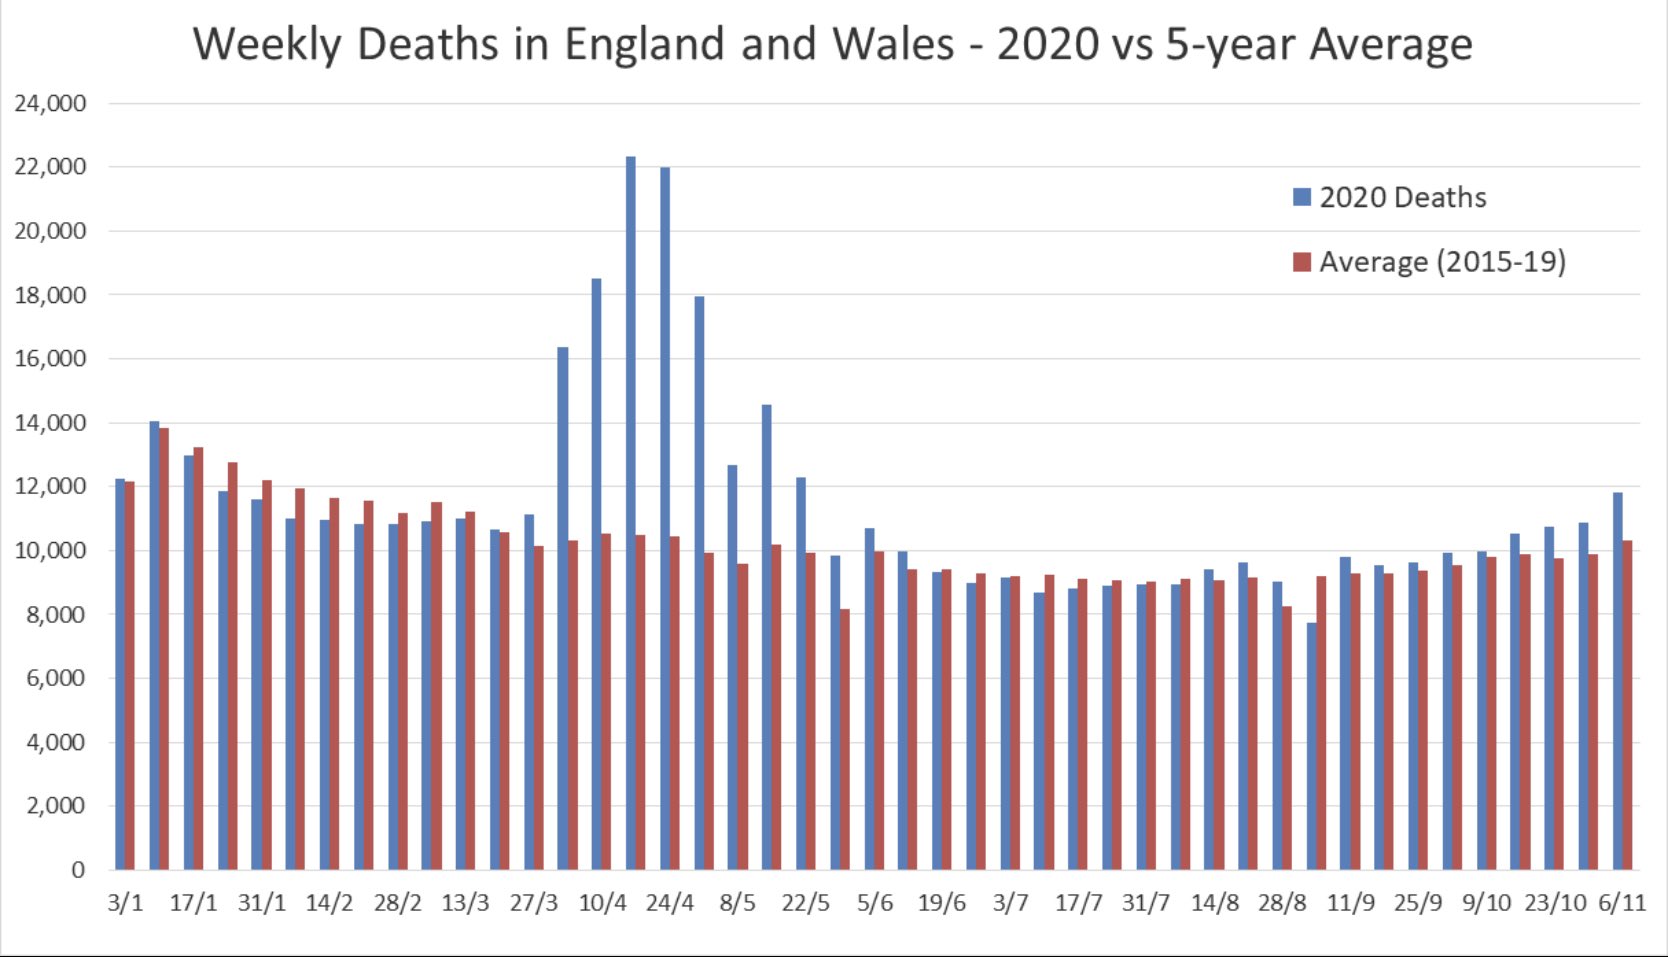
This is a timely chart from the ONS. Deaths this year vs the 5 year average. On that basis we are controlling the second wave better than the first, although deaths are now ticking up a bit

This is a timely chart from the ONS. Deaths this year vs the 5 year average. On that basis we are controlling the second wave better than the first, although deaths are now ticking up a bit

Last edited by Fellbeast; 18-11-2020 at 09:18 AM.